Data is everywhere. Every click. Every sale. Every scroll. Businesses collect mountains of it every day. But raw data alone is useless. What matters is what you learn from it. That is where data analytics tools come in. They help businesses see patterns, spot trends, and make smart decisions faster.
TLDR: Data analytics tools turn raw numbers into clear insights. They help businesses track trends, understand customers, and predict what might happen next. Popular tools like Tableau, Power BI, Google Analytics, and Looker Studio make data easy to explore with simple dashboards and charts. The right tool depends on your business size, goals, and budget.
Let’s break it down in a fun and simple way.
What Are Data Analytics Tools?
Think of data analytics tools as translators. They translate boring spreadsheets into colorful charts. They turn thousands of rows into clear stories.
Instead of staring at numbers like this:
- 10,245 visitors
- 3,542 sales
- 42% bounce rate
You get clean dashboards. Visual graphs. Easy-to-read summaries.
In seconds, you can answer questions like:
- Are sales going up or down?
- Which product is most popular?
- What day brings in the most customers?
- Where are we losing money?
That’s powerful.
Why Speed Matters in Trend Analysis
Trends move fast. Very fast.
What customers love today might be old news next month. If you wait too long to analyze data, you miss opportunities.
Fast analytics helps businesses:
- Adjust marketing campaigns quickly
- Monitor product performance daily
- Handle inventory more intelligently
- Predict demand changes
Speed equals advantage. The faster you understand trends, the faster you act.
Popular Data Analytics Tools Businesses Love
There are many tools out there. Some are simple. Some are powerful. Here are some of the most popular ones that help businesses understand trends faster.
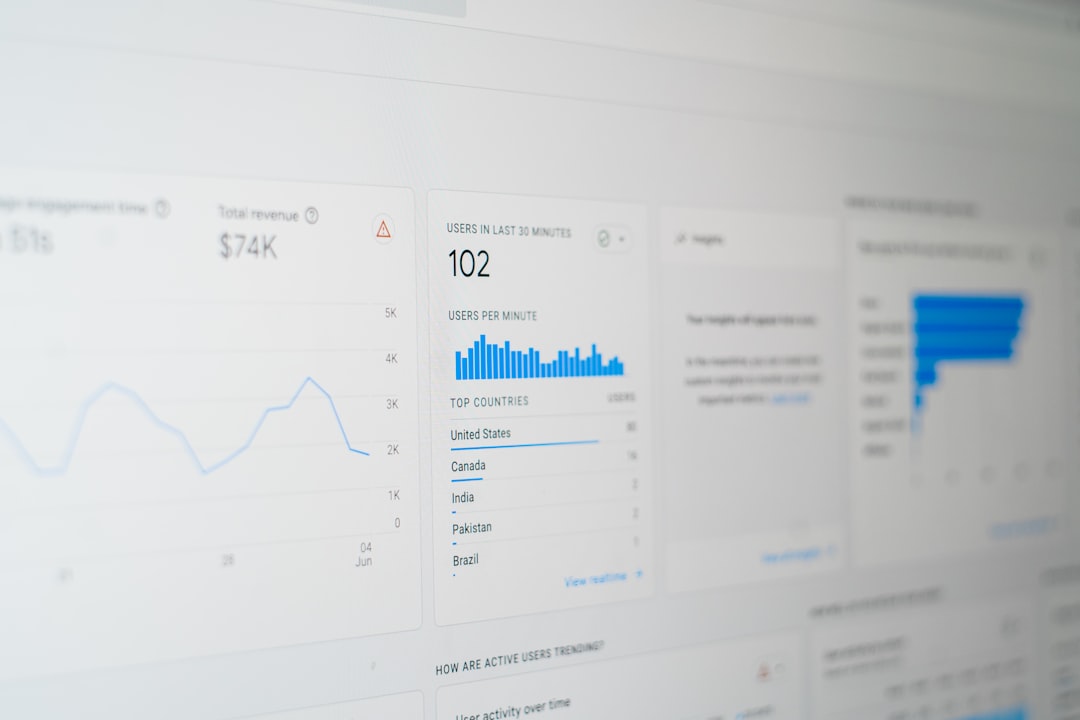
1. Google Analytics
This is often the starting point. Especially for websites.
Google Analytics shows:
- Where your visitors come from
- How long they stay
- Which pages they visit
- What makes them leave
It’s great for marketing teams. And it’s free to start.
Best for: Websites, online stores, small businesses.
2. Tableau
Tableau is powerful. It turns complex data into beautiful dashboards.
You can:
- Create interactive charts
- Connect to many data sources
- Build deep reports
It is popular with analysts and bigger companies.
Best for: Advanced data visualization and large datasets.
3. Microsoft Power BI
Power BI is a strong competitor to Tableau.
It works very well with Microsoft products like Excel and Azure.
It allows you to:
- Build real-time dashboards
- Share reports across teams
- Use AI-powered insights
Best for: Businesses already using Microsoft tools.
4. Looker Studio
Looker Studio (formerly Google Data Studio) is simple and user-friendly.
It connects easily with Google products.
- Google Ads
- Google Analytics
- Google Sheets
The interface is clean. Drag. Drop. Done.
Best for: Marketing dashboards and simple reporting.
5. Mixpanel
Mixpanel focuses on user behavior.
It tracks actions instead of just page views.
You can see:
- Which features users click
- Where users drop off
- How long users stay active
This is perfect for apps and SaaS companies.
Best for: Product teams and startups.

Quick Comparison Chart
| Tool | Best For | Ease of Use | Real-Time Data | Price Range |
|---|---|---|---|---|
| Google Analytics | Website tracking | Easy | Limited | Free / Paid |
| Tableau | Advanced visualization | Moderate | Yes | Premium |
| Power BI | Microsoft users | Moderate | Yes | Affordable |
| Looker Studio | Marketing reports | Easy | Limited | Free / Paid |
| Mixpanel | User behavior tracking | Moderate | Yes | Premium |
Key Features That Help Spot Trends Faster
What makes a data tool truly useful? Not just charts. But smart features.
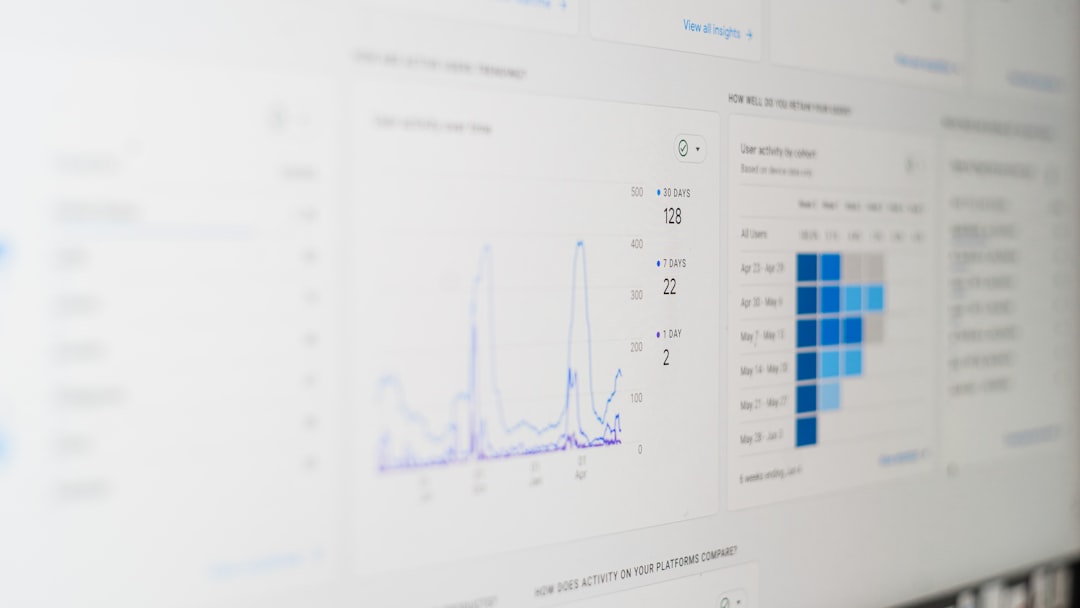
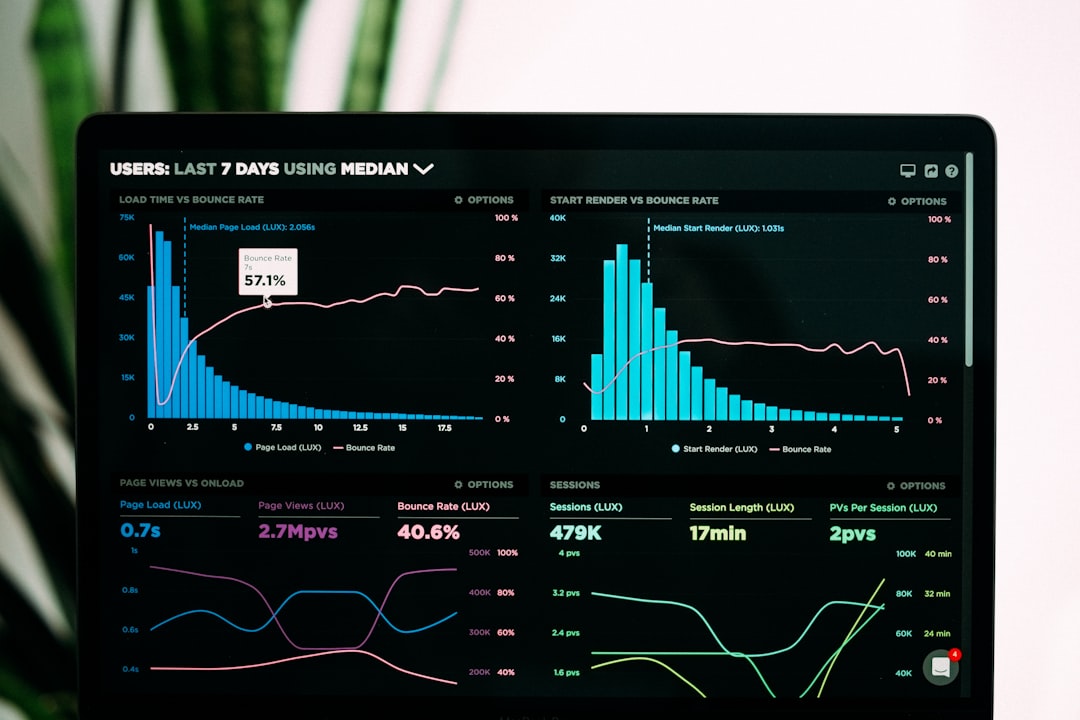
1. Real-Time Dashboards
See what is happening right now.
No waiting for weekly reports.
This helps with:
- Flash sales monitoring
- Website crash detection
- Campaign performance tracking
2. Automated Reports
No more manual spreadsheets.
Reports can be sent automatically to your inbox.
Daily. Weekly. Monthly.
This saves time. And reduces errors.
3. Predictive Analytics
This is where things get exciting.
Some tools use AI and machine learning to predict:
- Future sales
- Customer churn
- Demand spikes
Instead of reacting to trends, you prepare for them.
4. Data Integration
Businesses use many platforms:
- CRM systems
- Email tools
- Ad platforms
- E-commerce systems
Good analytics tools pull everything into one place.
That means less guessing. More clarity.
How Different Teams Use Data Analytics
Analytics is not just for tech teams.
Marketing Teams
- Track campaign performance
- Measure cost per click
- Understand audience behavior
Sales Teams
- Monitor conversion rates
- Track sales pipeline health
- Forecast revenue
Product Teams
- Analyze feature usage
- Identify bugs or drop-offs
- Improve user experience
Executives
- View high-level KPIs
- Spot long-term trends
- Make strategic decisions
Everyone benefits. When data is clear, decisions get better.
How to Choose the Right Tool
Not every business needs a complex system.
Ask yourself:
- What problem am I trying to solve?
- How large is my data?
- Do I need real-time updates?
- What is my budget?
If you run a small online shop, Google Analytics and Looker Studio might be enough.
If you are a growing SaaS company, Mixpanel or Power BI might be smarter.
If you handle massive enterprise data, Tableau could be the better fit.
Start simple. Upgrade when needed.
Common Mistakes to Avoid
Analytics is powerful. But mistakes happen.
- Tracking too many metrics. Focus on what matters.
- Ignoring data quality. Bad data equals bad decisions.
- Not training your team. Tools are useless if no one understands them.
- Looking at data without context. Numbers need explanation.
Keep it simple. Clear goals. Clear dashboards.
The Future of Data Analytics
The future is smart. And fast.
We are moving toward:
- AI-driven insights
- Voice-assisted dashboards
- Automated anomaly detection
- Self-service analytics
This means business owners will not need technical skills to understand their data.
You will just ask:
“Why did sales drop last week?”
And the system will tell you.
Simple.
Final Thoughts
Data analytics tools are not just nice to have. They are essential.
They turn confusion into clarity.
They turn numbers into action.
They turn trends into opportunity.
The faster you understand what is happening in your business, the faster you grow.
Start small. Pick the right tool. Build clear dashboards. Focus on meaningful metrics.
Because in today’s world, businesses that understand their data faster… win faster.